
Super Bowl LVIII will be played on a natural grass field in an indoor stadium in Las Vegas on February 11, 2024. How do you keep a grass field vibrant in such a hostile growing environment like the Nevada desert?
The answer: You don’t. By the end of the regular NFL season, paint was used to camouflage the reality that only a few scant patches of grass remained in Allegiant Stadium, home to the Las Vegas Raiders. Immediately after the Raiders’ last game on January 7, 2024, the field crew ripped up the remaining grass, installed California-grown sod over three days, and began the tedious process of keeping the grass alive long enough for the big game.
Herculean efforts to prepare a vibrant natural grass field for 2024’s Super Bowl LVIII are especially questionable when one realizes that Allegiant Stadium also has an artificial turf playing surface available (used by UNLV Football). Why don’t teams in hostile environments switch to more robust artificial turf, which is designed to overcome the many limitations of natural grass fields?
The answer lies in a debate over the safety of synthetic playing surfaces. While artificial turf manufacturers tout research that their products result in fewer injuries, the NFL Players Association (NFLPA) claims it raises injury risk and is advocating for its use to be abolished in the NFL. Let’s explore some key arguments of this debate, which continues to grab headlines with each high-profile NFL injury.
Super Bowl gridirons
Pressure for NFL field managers is especially high following the embarrassingly poor field conditions of last year’s Super Bowl. Super Bowl LVII took place at State Farm Stadium in Glendale, Arizona—another natural grass field in the desert (with a retractable roof, closed at night to protect the grass). Despite two years of preparation and an $800,000 investment, the grass field was a disaster, as players struggled to find footing on its slippery surface.
Veteran NFL groundskeeper George Toma attributed the mess to woefully improper field preparation. Players also complained about the slipping issue the previous time the Super Bowl was hosted at the natural grass field in State Farm Stadium eight years prior for Super Bowl XLIX in 2015. That year, the poor traction was blamed on the green paint used on the grass.
For perspective, some of the best sports field managers in the nation oversee field preparations for the Super Bowl. However, maintaining natural grass in desert conditions is so unfavorable (especially when the grass is sometimes indoors) that even the best can mess it up.
None of these issues existed when the Super Bowl was last played on artificial turf. Super Bowl LVI in 2022 was held at SoFi Stadium in Inglewood, California, home to both the Los Angeles Rams and Chargers. Not only did the artificial turf stand up to double the workload during the regular season (hosting home games for the LA Rams and the LA Chargers), but it also withstood a busy playoff season. The artificial turf field at SoFi Stadium hosted NFL games through the regular season and right up to the last playoff game when the LA Rams beat the San Francisco 49ers. Two weeks later, the Rams ended up winning Super Bowl LVI on the very same surface.
While turf avoids the durability issues seen with grass surfaces, players have widespread concerns about its safety—a recent poll by the NFLPA reported 92 percent of players favored grass.
High-profile injuries on artificial turf
Concern over injury risk associated with artificial turf in sport is not new—it can be traced back to Monsanto’s (yes, that Monsanto) development of AstroTurf (originally named “ChemGrass”). In 1968, Monsanto claimed that AstroTurf could “reduce football injuries by 80 percent.” Yet three years later, a study examining injury risk in high school football found a 46 percent higher risk in games played on artificial turf.
At the time, the mechanism behind this was proposed to be rooted in greater friction between the cleat and artificial turf. In the 50 years since, artificial turf has evolved from outdoor carpet laid over a hard surface into a more sophisticated product with a dizzying array of fiber types, infills, and padding. But half a century later, the controversy over its role in injuries remains, with politics and data each influencing perceptions.
For many, one play during Super Bowl LVI in 2022 on SoFi Stadium’s artificial turf field was all the evidence they needed for the turf’s injurious nature. Acclaimed Rams wide receiver Odell Beckham Jr. (nicknamed OBJ) scored the game’s first touchdown and was playing brilliantly on his home field. Then, minutes before halftime, he suffered a game-ending injury. During the play, immediately after stopping to catch the ball and with no defenders around, he went down in pain, grabbing his left knee.
It appeared to be a classic example of a non-contact anterior cruciate ligament (ACL) tear, and the artificial turf playing surface was immediately blamed. NFL players and alumni, in coordination with Pennington Grass Seed company, kicked off a social media campaign to ban turf. OBJ’s injury created a conversation about injury rates on natural grass versus artificial turf fields in the NFL that continued for much of the following 2022 season. When Aaron Rodgers tore his Achilles tendon during the first week of the 2023 NFL season, artificial turf was also considered the culprit, and calls to remove it arose again.
Do these high-profile cases justify the need to ditch artificial turf in favor of natural grass fields? Let’s dissect some of what we know about lower extremity (e.g., foot and leg) injury risks in sports and the role surfaces play in NFL injuries. First, we need to consider how players get injured and why artificial turf could influence this. Next, we need to examine what the injury data actually tells us. Finally, we need to put all of these numbers in context.
Sports injury risks
High-profile injuries, like those of OBJ and Rodgers, are the culmination of multiple intrinsic and extrinsic risk factors. Intrinsic risk factors are characteristics of the individual, such as injury history, sex, age, anatomical factors, biomechanics, etc. Extrinsic risk factors are characteristics external to the individual, such as environment (including the playing surface), equipment, training, etc. Injury can be thought of as occurring after a player with one or more intrinsic risk factors is exposed to one or more extrinsic risk factors and an inciting event occurs, one where the forces applied to the body’s tissue exceed a threshold for damage.
Assigning weight to individual intrinsic and extrinsic risk factors—saying how much they did or did not contribute to an individual injury—is nearly impossible. This is especially true in “non-contact” injuries such as OBJ’s. Unlike contact injuries, where the force on the body is visible, non-contact forces stem from impact on the ground and muscle contractions. As such, non-contact injuries are thought to have a greater contribution from intrinsic risk factors.
One of the biggest intrinsic risk factors is previous injury. Twenty percent of male athletes with a previous ACL tear experience another ACL tear (in the same or opposite leg), and a previous ACL tear increases the risk of another traumatic knee injury by 2.7-fold in adult male athletes. Leading up to Super Bowl LVI, OBJ already had an extensive injury history, including an ACL tear two years earlier. And it turns out he didn’t actually have an intact ACL to tear during the Super Bowl (some athletes can function without one) but rather experienced a severe episode of knee instability due to its absence.
Previous injury was also a likely intrinsic risk factor that contributed to Rodgers’ left Achilles tendon rupture. Less than one month before his headline-grabbing injury, he was limping around with a left calf injury during training camp. It’s a muscle he has injured on multiple occasions. Rodgers also had broken his left foot in 2006 and a left toe in 2021. Previous foot injury is a known risk factor that doubles the risk of Achilles tendon ruptures in NFL players.
Given the intrinsic risk factors for OBJ and Aaron Rodgers, is it wrong to say the field was the reason for the injury? Mostly, yes—“the field” is only one of a list of risk factors. Additionally, the field is just one factor that is responsible for the ground forces that an athlete’s body experiences during sport, the other being the cleats that an athlete wears. The field’s contribution to non-contact lower extremity injury is entirely dependent on the cleat-surface interaction.
Cleat-surface interactions
Cleat-surface interaction is characterized by the resistance of the cleat to sliding, twisting, pushing off, landing from a jump, braking from a sprint, etc. Cleat-to-surface interactions are not a new concept—a 1959 paper from the Journal of the American Medical Association describes the potential role of cleats in football injuries, and a 1969 study recommends “shortie” cleats because they were associated with far fewer injuries in high school football.
The cleat-surface interaction gets complicated very quickly. For example, resistance to cleat twisting (or “rotational traction”) varies across artificial turf constructions, infill, grass species, soil moisture, and cleat type (there are soft and hard ground cleats, for example). Across three studies in high school football players, shoes with greater rotational traction were found to increase non-contact lower limb injuries by 2.5-fold, regardless of playing surface. When the combined contributions of cleat and surface were considered, high rotational traction cleat-surface interactions increased non-contact lower limb injuries by close to 4.5-fold.
That’s a lot. Why would athletes choose to wear footwear that increases injury risk so much? The extra friction should theoretically enhance agility and reduce slipping. So cleats are a trade-off between performance and injury risk.
OBJ’s injury is a good example of how complicated cleat-surface interactions can get. To start with, OBJ was playing in new custom cleats. Additionally, the field wasn’t entirely uniform. Logos were painted on the field prior to Super Bowl LVI, and the Bengals’ players and coaches noted that these logos influenced the field’s traction in those spots. As such, Bengals players were told to “control yourself” in the painted NFL logo in the middle of the field. However, Rams players had played extensively on the field (13 home games and an unknown number of practices), so they may not have taken the time to survey it carefully. OBJ’s knee gave out precisely over the freshly painted area.
Was it the underlying artificial turf that caused OBJ’s injury or the altered friction between the paint and his untested shoes? How much did his injury history contribute? Herein lies the danger of using a single injury as evidence of a broader claim that a given type of field is more or less dangerous: there are numerous other factors that ultimately drive injury risk.
What do the numbers say about artificial turf injuries in the NFL?
Epidemiologic studies comparing the risk of lower extremity injuries on different types of playing surfaces should provide better insight into the debate than prominent anecdotes. Before we dive into the research, it’s critical to provide a disclaimer: Inconsistencies in study methodology make it challenging to make sense of the collective research findings within a single sport, let alone between different sports at different levels. For instance, the definition of “injury” varies from study to study. Some studies compare the rate of all injuries (e.g., arm, leg, torso, and head) between surfaces, while others limit their analysis to only lower extremity injuries or a specific type of injury (like ACL tears).
Even the sources used to identify injury vary. Some studies use the official NFL Injury Surveillance System and team medical records, while others use publicly available records (e.g., injury reports and news stories). Not surprisingly, these sources produce different results. One may assume that studies using the official NFL sources would be more accurate, but a New York Times investigation identified over 100 concussions that were not included in the NFL’s own analysis from 1996 to 2001.
Definitions of injury mechanisms (e.g., contact versus non-contact) are also surprisingly inconsistent between studies. Non-contact and contact injury mechanisms should be self-explanatory. They either don’t involve contact with another player (like Bradley Chubb or Sterling Shepard) or they do. However, non-contact injuries are sometimes grouped with surface-contact injuries. Surface injuries are when a player falls or is pushed to the ground and suffers an injury (this may be what happened in Donovan McNabb’s 2006 ACL injury).
Additionally, some studies break injuries into “direct-contact injuries” that occur at the location of the tackle (e.g., Carson Palmer’s or Nick Chubb’s [warning: graphic] knee injuries) and “indirect contact.” The latter occurs during or after a tackle where physical contact occurred on a part of the body other than where the injury took place (like Saquon Barkley’s ACL injury or Rodgers’ Achilles tear).
Every year, the NFL releases results from an ongoing study comparing injury incidence on artificial turf and natural grass game fields (Figure 1). The injuries included in this study are “non-direct contact” lower extremity injuries—this is a combination of “non-contact” and “indirect contact” injury mechanisms.
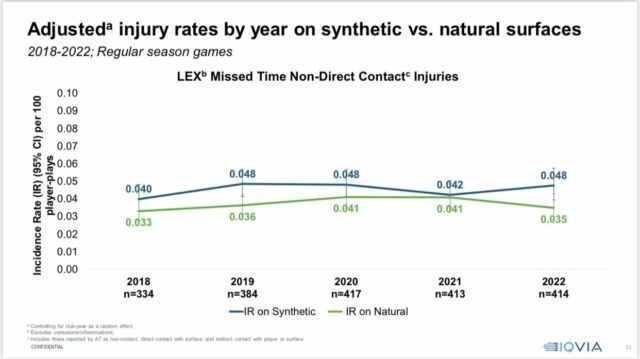
Right off the bat, we see that artificial turf has a higher incidence rate of non-direct contact lower extremity injuries every year. We also see there is overlap in variances of injury rates (the vertical bars). This overlap indicates that some grass fields have high injury rates, and some turf fields have low injury rates. (Data from the 2023 season indicates an equal rate between surfaces, similar to 2021.)
In response to this data, the NFLPA is advocating for the replacement of all artificial turf practice and game fields with natural grass. But in doing so, would the NFL be throwing some proverbial babies out with the bathwater? Some low-injury rate artificial turf fields could potentially be swapped out for high-injury rate natural grass fields. In an independent analysis of injuries per game by stadiums in the NFL, natural grass fields ranked both the best and the worst stadiums in the league. Allegiant Stadium, host of Super Bowl LVIII, is ranked worst, with its natural grass field having an average of 6.5 injuries per game.
“Best” and “worst” must also come with a qualifier—there’s not much of a difference between them. The best field had an average of about 4.75 injuries per game, and the majority of fields (28 of 30) were in between five and six injuries per game. And it’s not always clear how the fields differ; a single manufacturer makes the artificial turf installed at one of the NFL’s lowest-risk fields (NRG Stadium), one of the highest-risk fields (SoFi Stadium), and one with near average risk (AT&T Stadium). So, while there might be a slight tendency toward higher injury rates on artificial turf, it’s clear that other factors play critical roles.
When analyzing injury rates between artificial turf and natural grass fields in the NFL, different conclusions may be reached depending on how one crunches the numbers. Some of the most cited numbers come from a peer-reviewed paper by IQVIA, an independent analytics firm that the NFL has contracted. Statistics from the NFLPA are also commonly cited, although the organization doesn’t disclose its methodological details. Following Rodgers’ injury, an independent sports analytics company, Sports Info Solutions, produced another analysis. As shown in Table 1, one can use these numbers to claim that artificial turf increases or decreases the risk of NFL injuries. Note how some analyses favor grass (IQVIA and NFLPA for non-contact knee injuries) and others favor turf (SIS for non-contact knee injuries). Likewise, SIS found 10 percent more ankle injuries on artificial turf, but when restricted to only non-contact ankle injuries, turf has 3 percent fewer injuries.
Table 1: Examples of different conclusions about injuries, based on different analyses
| Source | IQVIA (peer-reviewed research paper) | NFLPA (organization summary statement) | SIS (independent website narrative) |
| Data Analyzed | 2012–2016 NFL regular season games | 2012–2018 NFL data (assumed to include practices) | 2017–2020 NFL regular-season games |
| All lower extremity injuries | 16% more likely on artificial turf | Not stated | On artificial turf:
|
| “Non-contact” lower extremity injuries * | 27% more likely on artificial turf | 28% higher on artificial turf | 12% fewer on artificial turf |
| “Non-contact” knee injuries * | 46% higher on artificial turf | 32% more on artificial turf | 18% fewer on artificial turf |
| “Non-contact” ankle injuries * | 68% higher on artificial turf | 69% more on artificial turf | 3% fewer on artificial turf |
* “Non-contact” is defined differently for each group. IQVIA includes “surface contact” injuries in this group (e.g., a player injuring their knee by hitting it on the ground). The NFLPA does not specify whether surface contact is included. SIS specifically states that they do NOT include “contact with ground” in their “non-contact” category (and provide separate figures for “contact with ground.”)
Given these inconsistent methodological factors, it should not be surprising that there are conflicting findings in the peer-reviewed literature, as well. For example, a study across four NFL seasons (2010–2013) found playing surface was not statistically associated with ACL injuries; this was confirmed in a later study (2017–2021 seasons). Yet across an earlier period of 10 NFL seasons (2000/2001–2009/2010) ACL tears (67 percent) and eversion ankle sprains (31 percent) were significantly higher on artificial turf compared to natural grass. In that same study, medial collateral ligament tears and inversion ankle sprains were not statistically different between fields.
These findings included ACL injuries from all mechanisms; a different study broke ACL injuries down by direct contact, indirect contact, and non-contact mechanisms, using information from six consecutive NFL seasons (2014/2015–2019/2020). They reported that only 26 percent of ACL tears are non-contact, and the number of non-contact ACL tears is similar on natural grass and artificial turf fields.
How you crunch the numbers matters. Do you think all injuries (contact and non-contact) should be considered when determining the risk of the playing surface? Should only true non-contact injuries be considered? Or can we include some contact injuries, like indirect contact or surface contact? How one answers these questions is directly related to the conclusion that is reached.
Football causes injuries
At the individual level, every injury matters—nobody wants to miss a game, let alone develop the chronic pain and dysfunction that often follows major orthopedic injuries. However, when we consider the NFL as a whole, the debate over the field type just skims the surface of a much broader injury epidemic. Using IQVIA’s numbers, we could hypothesize that lowering artificial turf’s injury rate to natural grass’s injury rate (and keeping all other factors unchanged) would have theoretically reduced the total number of lower extremity injuries over their five-year study period. But the drop would have been from 4,801 to 4,482—we’d still be left far from a sports safety utopia.
The point is this: Football requires intentional contact between large, strong, and fast individuals, and this is a recipe for injuries.
If every field in the NFL had the injury rate that the best fields have now (about five injuries per game), the game might become marginally safer, but its players would still be at far greater injury risk than those playing any other mainstream American sports. Few studies have directly compared injury risk between American men’s professional sports, but we provide some very rough approximations below in Table 4. Injuries are part of all sports, but studies consistently show that football has especially high injury rates—changing the playing surface does not offer a quick fix for this issue.
Table 2. Estimates of men’s ACL tears and Achilles tendon ruptures in selected American sports
| Sports organization | Years/seasons studied | Total number | Injuries/year | Injuries/1,000 players/year |
| ACL tear | ||||
| Major League Soccer (MLS) | 2011–2015 season | 66 | 13.2 | 23.2 |
| National Basketball Association (NBA) | 2006/2007–2021/2022 | 47 | 2.94 | 6.5 |
| National Hockey League (NHL) | 2006/2007–2015/2016 | 67 | 6.7 | 9.7 |
| 2006/2007–2010/2011 | 47 | 9.4 | 13.6 | |
| NFL | 2015/2016–2019/2020 | 314 | 62.8 | 37.0 |
| Achilles tendon rupture | ||||
| MLS | 1996–2016 seasons | 22 | 1.1 | 2.6 |
| NBA | 1970/1971–2018/2019 | 44 | 0.9 | 2.0 |
| NFL | 2010/2011–2016/2017 | 109 | 15.6 | 9.2 |
| 2010/2011–2015/2016 | 78 | 13 | 7.7 | |
MLS (ACL): 570 players in 2011–2015. (19 teams on average in 2011–2015; 30 players per team)
MLS (Achilles): 430 players in 1996–2016. (14.3 teams on average in 1996–2016; 30 players per team)
NHL: 690 players. (30 teams; 20 players suited per team per game, 23 on roster)
NFL: 1,696 players. (32 teams; 53 players on roster, 46 players suited per team)
NBA: 450 players. (15 players on roster; 13 active per game; 30 teams.)
Conclusions
The NFL and NFLPA have both emphasized that optimizing player health and safety is important, but injuries, some serious, are inherent to the game. Theoretically, some rule changes could go a long way. NFL executive Jeff Miller has stated that a technique called the hip-drop tackle has a 25-fold higher (2,500 percent) injury risk than a normal tackle (though the NFL has not provided data or peer-reviewed papers to support this claim). If we accept the 16 percent figure on increased risk of injury on artificial turf, it’s clear that its impact is trivial compared to other potential changes.
(The NFL has actually considered banning the hip-drop tackle for player safety, but the NFLPA has argued that prohibiting this technique is “unfair to players and unrealistic to implement.” However, Australia’s National Rugby League did manage to ban this dangerous technique.)
And things don’t always work out like we expect. Other rule changes to improve game safety have had a marginal impact—eliminating the “chop block” in the 2016/2017 season reduced knee injuries by 16 percent, but the implementation of the targeting rule in the 2018/2019 season resulted in only a 3 percent injury reduction. One study found no change in injury rates over 10 NFL seasons (2010/2011–2019/2020) despite continual emphasis on player safety.
There are players who prefer natural grass to artificial turf fields and those who prefer artificial turf over natural grass fields (although players were united in their hatred of Phoenix’s natural grass field when it was last used in Super Bowl LVII). The evidence does point to fields having some effect on injury, but we are oversimplifying the topic if we focus exclusively on categories of fields instead of trying to gain a deeper understanding of the means and degree to which a field can increase or reduce the risk of injury. For the leaders of the league and the game of football to do right by its players, we need to—and can do—better.
Dr. Richard (“Trey”) Brindle has a PhD in Biomechanics and is the director of research and innovation at Shaw Sports Turf. At Shaw Sports Turf, Dr. Brindle is working to reduce the impact of extrinsic risk factors for non-contact injury during athletic movements such as jump landing, running, and cutting.
James M. Smoliga, DVM, PhD, is a professor in the Department of Rehabilitation Sciences at Tufts University School of Medicine and director of research for its Doctor of Physical Therapy (Seattle) Program. Dr. Smoliga’s areas of study include sports injuries, human performance, and research integrity.