Yesterday, Bitcoin started the month of May in the worst way by brutally breaking the $60,000 price support, thereby changing the forecast outlook.
In the morning, selling was so consistent that it pushed the cryptocurrency below $57,000 USD, only to recover slightly in the evening.
Now let’s look at the future price forecast for this month: is the bull market over or is there still room for a bullish move?
Let’s see everything in detail below.
Bitcoin opened in May breaking $60,000 USD support: price prediction
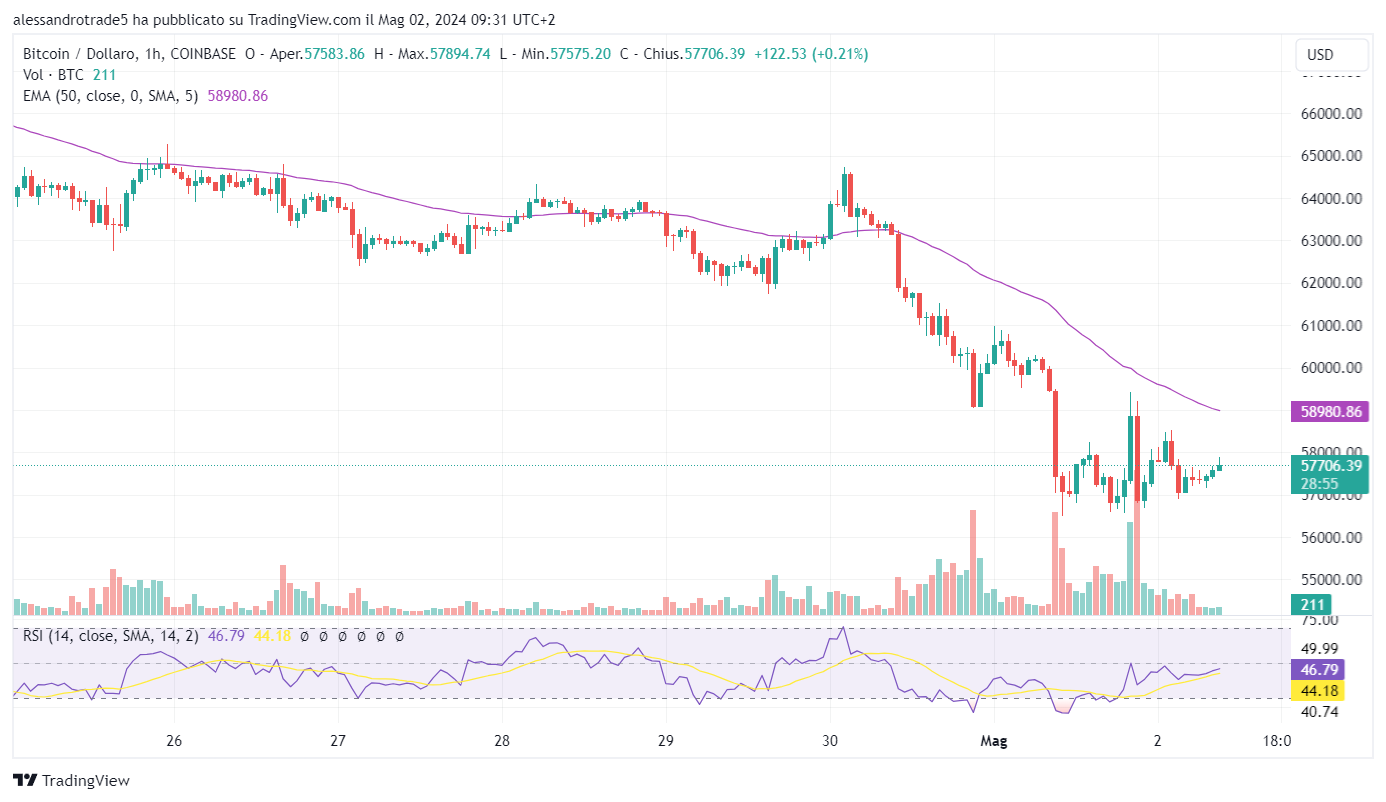
Labor Day on May 1 is painted red in the crypto market after Bitcoin experienced a significant decline leaving its price below the significant support of 60,000 USD and making traders reluctant to make optimistic predictions.
The largest portion of the selling action was concentrated in the time period from 08.00 to 10.00 am.where the currency hit a minimum of 56,550 USD, then recovered slightly in the afternoon and signaled a slow recovery in the evening.
Specifically, at 20:000 there was a brief upward attack at the price of 59,000 USD, which was quickly eaten by a decline on the following hourly candle.
At the time this article was written, the price of Bitcoin was around 57,700 USD, the market capitalization was 1.136 trillion dollars, and the volume in the last 24 hours was around 46 billion dollars.
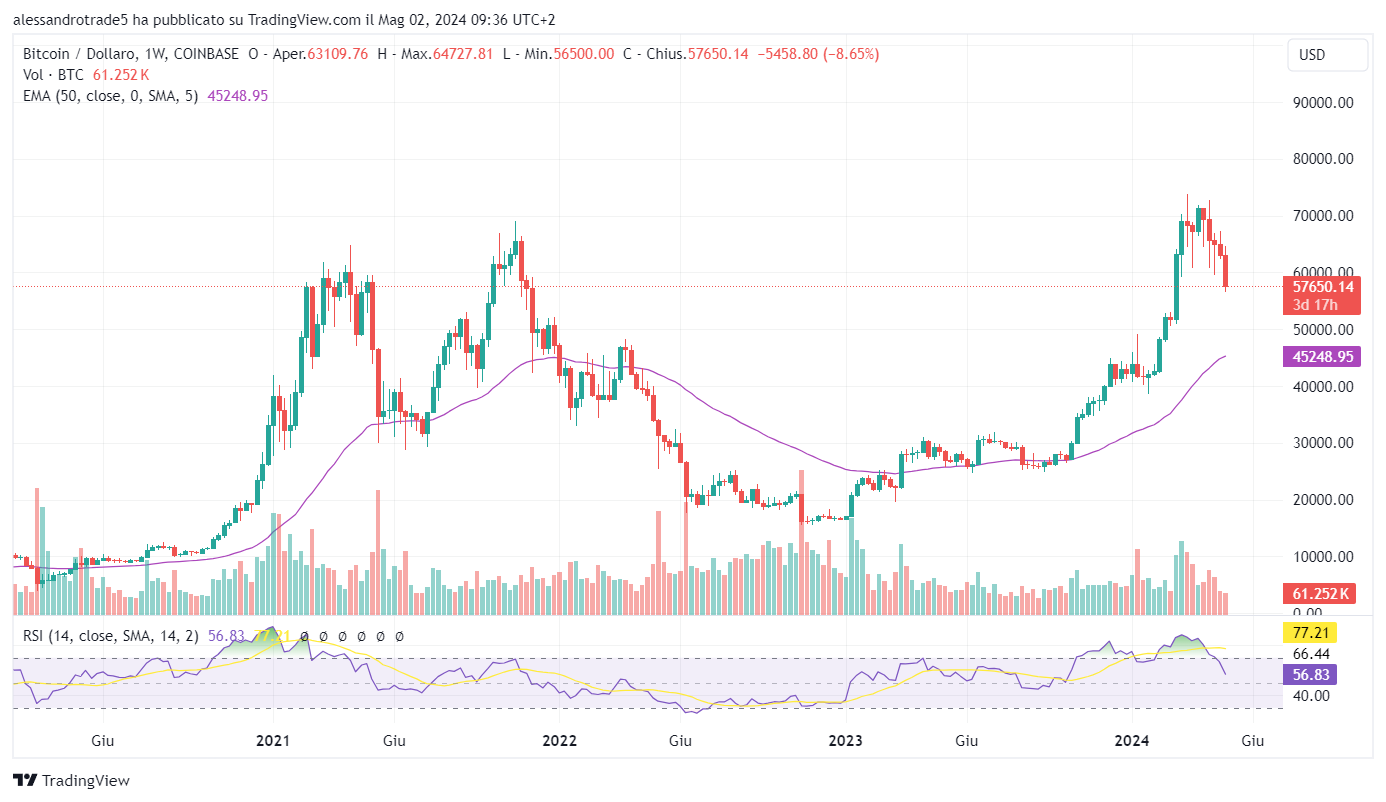
Expanding our horizons, we can see clearly how This week’s discharge definitely marks the formation of a very strong top (not necessarily the ATH of this cycle).
Even the RSI, which has been in overbought territory for several months, has been rejected downwards, a sign that the bears are currently in control of the market.
The entire month of May is potentially boring for Bitcoin price movements and also for other asset classes such as shares: as the saying goes “sell in May and walk away“, usually from May to October disappointing performance is recorded in the stock market.
The first thing to do now before making medium-term forecasts is to look for support capable of sustaining the ongoing decline: if the price rebound starts from $57,000, we can consider yesterday’s move as a false move.
If the capitulation continues to 52,000 USD or worse to 48,000 USD, recovery may take longer, ruling out the instant recovery option.
Below 48,000 USD we can welcome a formally bearish summer, with a possible recovery starting in the last quarter of the year.
For now, NO PANIC: we are still in a valid macro range, where the Bitcoin chart can start again at any time.
Analysts at cryptocurrency exchange Bitfinex agree May will be a month of rest for Bitcoinleaving room for potential breakout attempts on both sides of the chart without being able to take a decisive direction.
Here’s what their weekly analysis reports:
“We believe we can see Bitcoin price consolidation in 1-2 months, trading in a range with $10,000 fluctuations on either side. We expect the positive impact of the halving, which led to a reduction in Bitcoin supply, to be seen in the coming months. At this point, the economy is also expected to perform better, achieving a soft landing and avoiding a recession, thereby providing further momentum for the cryptocurrency.”
On-chain settlement and data
Yesterday, the loss of 60,000 USD for Bitcoin and subsequent selling caused several bullish positions to be liquidated in the cryptographic derivatives market, with total liquidations of 250 million dollars.
It is worth noting that the day before, another 330 million dollars was liquidated while the cryptocurrency lost 63,000 USD in price.
Currently, although the forecast suggests the possibility of a prolonged sideways movement for several weeks/base, the most important liquidation level is consolidating.
In particular, in the range from $56,800 to $56,000 we find around $500 million of potential liquidations in the event of a downside breakout, while around $67,300 we find over $2 billion of hypothetical bearish liquidations. Above $71,500, another pool of short positions worth billions of dollars is ready to be triggered.
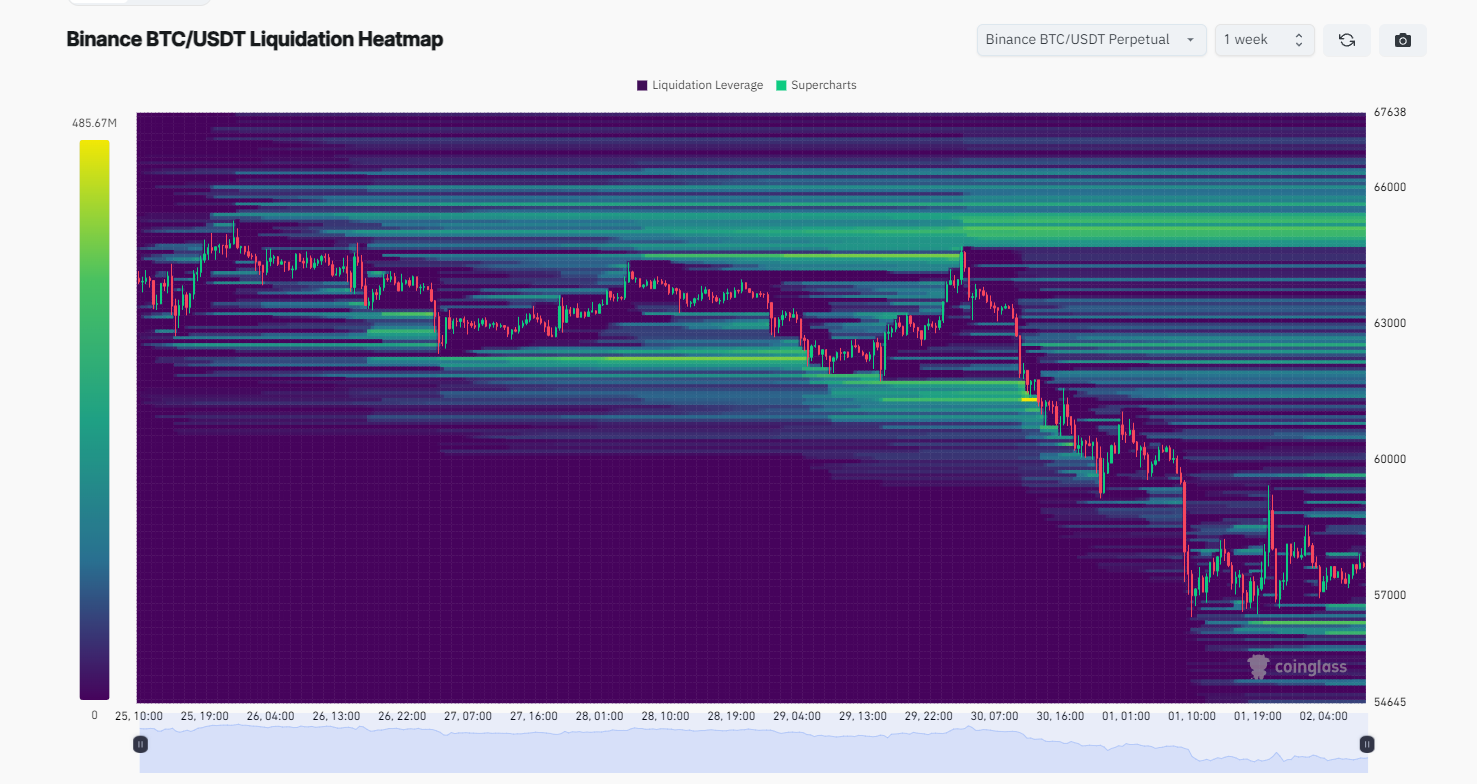
Source: Coinglass
Although Bitcoin’s price decline shifted the forecast bias to the negative, open interest shows that the situation is not as dramatic as it seems.
Despite the volatility, the indicator remained around $16 billion yesterday, behaving very differently compared to April 13 when a similar bearish price movement was recorded.
This makes us understand that interest in speculation is still relatively moderate/high and the decline has not killed the market.
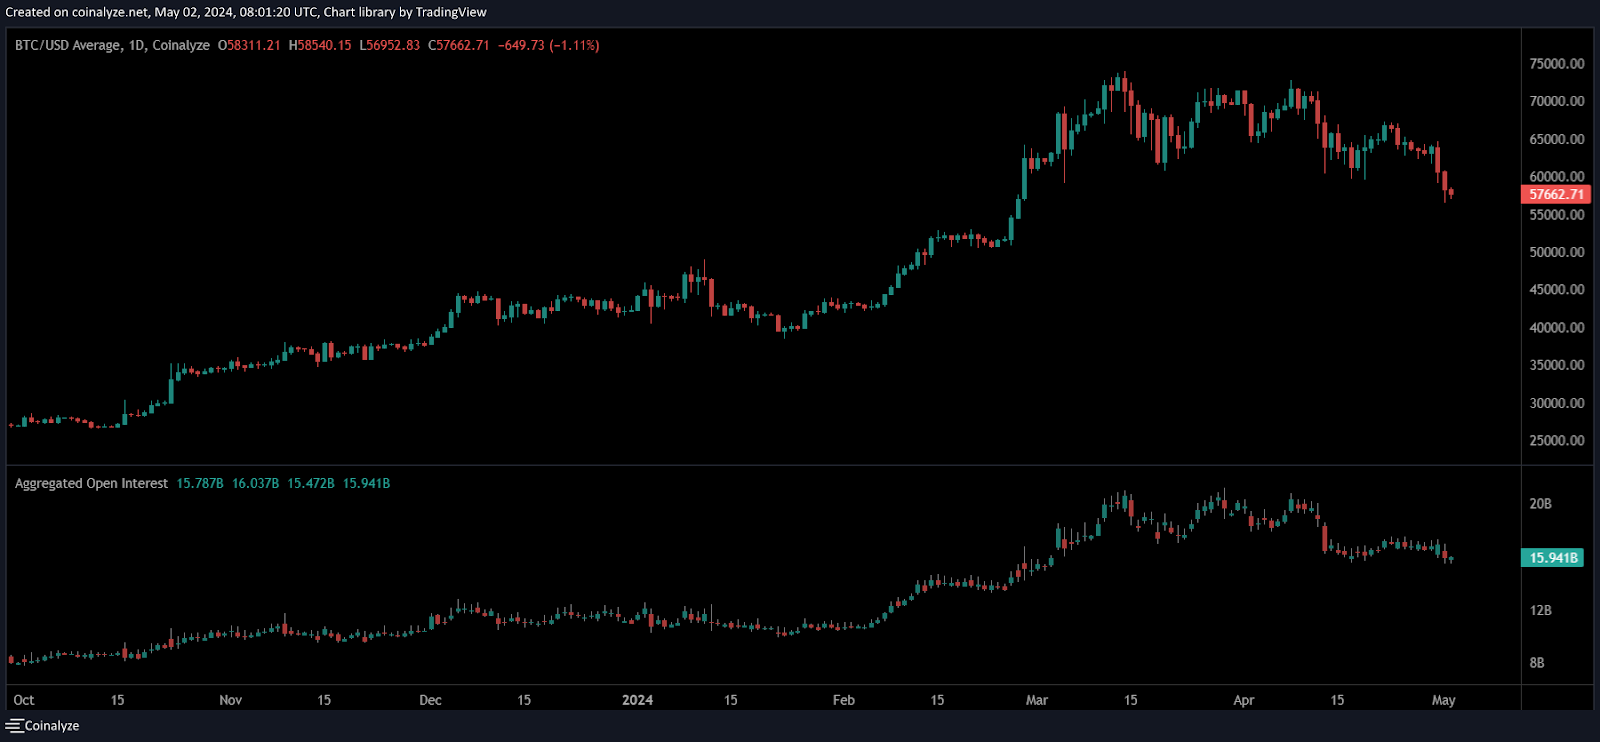
Source: Coinalyze
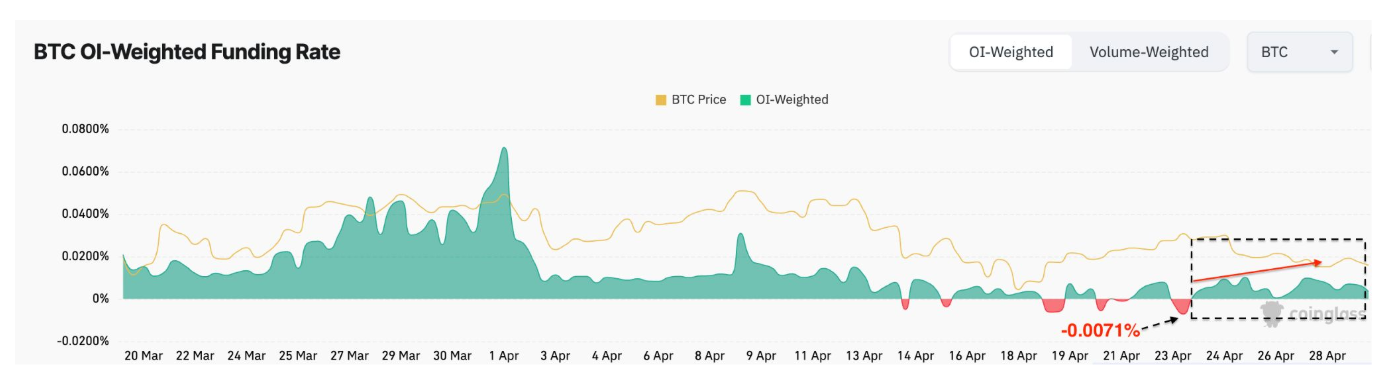
The derivatives market funding rate is still positive despite experiencing a significant decline in recent days.
Additionally, by looking at the indicator in a “weighted” version with open interest, we can observe a significant move on April 24, where we see a transition from negative territory to positive territory, a sign that the bulls are paying dearly to maintain it. their position is open.
It means The bullish spirit has not disappeared from the market and there may be some unexpected surprises in the coming days.
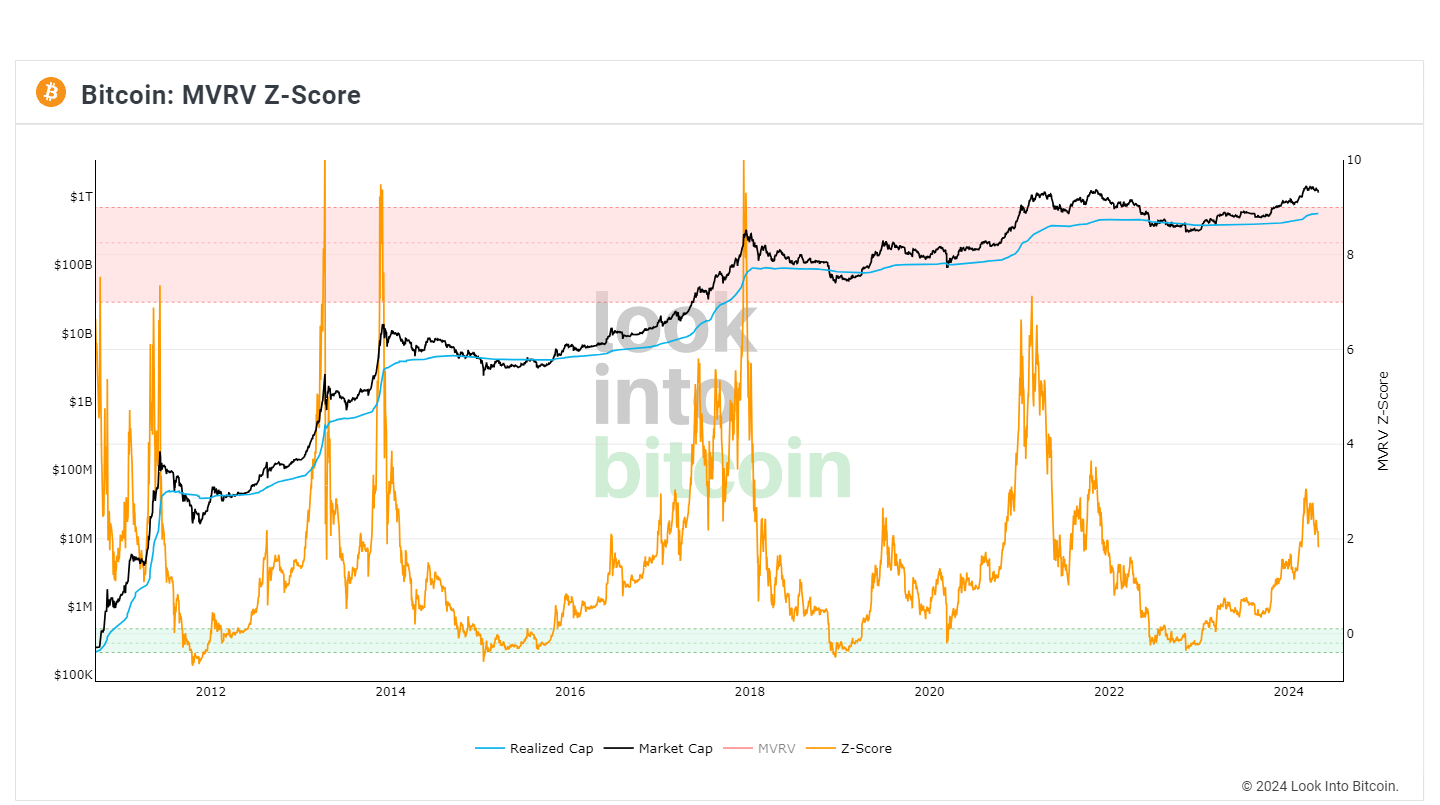
To conclude the analysis, we report the graph “MVRV Z score” of Bitcoin, which serves to identify whether a cryptographic asset is overvalued or undervalued compared to its fair value.
In general, with a ratio above 3.5 the currency can be overvalued, while with a ratio below 1.5 the opposite will occur.
At current levels, the chart shows this Bitcoin still has a lot of room to print a green candle and could currently be undervalued by the market.